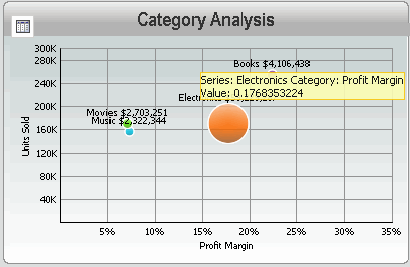
A tooltip is pop-up text that is displayed when a user positions the cursor over a document control in MicroStrategy Web. Tooltips are displayed only in the Flash mode of a document.
For example, in the grid report below, a tooltip is displayed when you pass your cursor over a bubble in the graph. In this case, the tooltip lets a document analyst know that he or she is looking at the data bubble for the Electronics product category; it also lists the exact profit margin value for that category.

You can use tooltips to provide extra information, such as the full company name in the tooltip of the company logo. Tooltips are also useful when a document has narrow columns that do not allow for full descriptions of the metrics. You can place that information in tooltips.
You can use tooltips on the following types of controls:
Panel stacks (all panels in the panel stack display the same tooltip)
Open the document in Design or Editable Mode.
Add one of the controls listed above. For steps to add a control to a document, see About creating documents.
Right-click the control and select Properties and Formatting. The Properties and Formatting dialog box opens.
From the left, select General.
Type the pop-up text in the Tooltip field. You can type any of the following:
Static text, such as The Company, Inc.
Data fields from the dataset reports, such as the Region attribute. Be sure to type the object name inside braces {} to indicate that it is a data field rather than static text.
Auto text codes, such as the document name or the dataset report name. Be sure to type the auto text code within braces {}. For lists of the auto text codes, see Auto text codes for documents and Auto text codes for datasets.
Click OK to apply the changes and return to the document.